 Caution:
Pitfalls using Department of Energy, OpenEI, and recent NREL energy and hourly
load data for
utility customer market-oriented analysis
Caution:
Pitfalls using Department of Energy, OpenEI, and recent NREL energy and hourly
load data for
utility customer market-oriented analysis
The OpenEI source provides commercial and residential engineering model-based hourly
8760 load results for various weather locations for a limited set of
commercial (16) and residential (3) building model input assumptions that typically do a poor job of
reflecting the population in any specific area
and cannot reflect the diversity of customers in market segments of
interest.
NREL has recently completed a large-scale project to provide hourly loads for 14 commercial buildings and 5 residential
buildings across the US. The mega-database include 900,000+ hourly load profiles that can be applied to various geographic
areas. These data were developed to support detailed energy efficiency & electrification initiatives.
Application of these data for most of the analysis promoted by NREL requires significant
engineering expertise including recommended cloud-based analysis.
These NREL-derived energy use and hourly loads data sources are poorly suited to meet the
analysis needs of most companies, state agencies and
other organizations because they:
-
Provide energy use and hourly loads data for only prototype (i.e., assumed) buildings with assumed
physical and occupant characteristics that are unlikely to reflect customer segments of interest
- Reflect occupancy hourly load data that are assumed to be the same across all individuals
-
Ignore variations in occupant characteristics (e.g., income, floor space, household members),
instead assuming average values that prevent important segmentation opportunities
The recent NREL mega-databases are so large that processing for many applications would require a
cloud-based approach (their suggestion). A user-interface does provide summary energy use and load profiles
for whole buildings and end-uses; however, the prototype regularity of the end-used profiles limits
their applicability for most applications. Consequently, the following comments focus on
Open-EI application issues; however, many also relate to the recent NREL databases.
This limited Department of Energy data are free so we understand why some companies start their market information
development with these data sources;
however, considerable wasted time and costs are typically associated
with an attempt to use these data for meaningful market-related
information. Feel free to review our comments on pitfalls of using these data below and
contact us for additional discussions.
Many of our clients come to us after frustrating attempts at applying these data for their market-related
analysis. Small sample databases (typically 5 - 9k customers for the entire US) end up being of little use when assessing market
segments whether defined by geography (e.g., states or metro areas) or
customer characteristics (e.g, business type, income level). Confidence intervals of +/- 50 are
not unusual for these segments.
The OpenEI commercial and residential engineering model-based hourly 8760 load results
reflect a limited set of model input assumptions that typically do not reflect the population
and cannot reflect the diversity of customers in market segments of
interest.
MAISY Utility Customer Energy Use and Hourly Load Databases have been developed specifically to serve the
real-world information needs
of energy-related organizations in addressing energy market-related issues. Having served more than 150 clients ranging
from start-ups to Fortune 50 companies, we
understand market-based analysis needs. With databases of more than 7 million utility customers including hourly data based
on metering studies, MAISY databases provide superior market intelligence with unequaled accuracy.
This limited Department of Energy data are free so we understand why some companies start their market information
development with these data sources;
however, considerable wasted time and costs are typically associated
with an attempt to use these data for meaningful market-related
information. Feel free to review our comments on pitfalls of using these data below and
contact us for additional discussions.
Pitfall 1: Applying Department of Energy Residential (RECS) and Commercial (CBECS) energy use/customer data to
assess energy-related markets
The US Department of Energy EIA's RECS (Residential Energy Consumption Survey) and CBECS (Commercial Buildings
Energy Consumption Survey) surveys provide annual energy use information on individual utility customers throughout the United States.
While RECS and CBECS data are useful for some national and large region analysis, small survey sample sizes on the order of
6,000 - 8000 customer records means that developing information for smaller geographic areas or market segments result
in unacceptably large confidence intervals. For example, see the description above where, the CBECS 95% confidence
interval on food sales fuels consumption in the West Census region is +/- 95%. Drilling down to more building-specific segments
defined by say square feet, electric space heat or other variables generates even more uncertainty. MAISY Utility Customer
Databases overcome this inability to evaluate market segments by detailed geographic areas, building and occupant
characteristics and other variables by maintaining databases composed of more than 7 million utility customer records. See
the section above "MAISY Database Accuracy/Comparison With Other Data Sources" for a more detailed comparison of the Department
of Energy's RECS/CBECS and Jackson Associates utility customer databases.
Pitfall 2: Applying The Department of Energy's OpenEI NREL Hourly Loads data to
assess energy-related markets
The US Department of Energy funded development of several large energy use and hourly load data sets
currently available on OpenEI NREL.org. Data sets reflect engineering model-based energy use and hourly loads
for 16 commercial
building types and 3 residential building specifications for 1020 TMY3 weather locations.
Model-simulated hourly kW loads
data are presented for several individual end uses (heating, air conditioning, etc.) for each building type/location.
Prototype building shell and other model inputs are documented in OpenEI-linked references. Specifications
for residential
prototype buildings are presented in the graphic below. These datasets appear to have been
developed and provided on OpenEI in 2013.
It is not clear who the DOE intended to use these data; however it is clear that the
prototpye building engineering energy/hourly load analyses ARE NOT APPROPRITE
for market-related evaluations such as market sizing,
product design/development, sales and profitability analysis and other market-oriented applications. The OpenEi
energy and hourly load databases
ARE NOT RELIABLE when used for the following applications:
- Market evaluation/sizing
- Product design/development
- Sales strategy development
- Sales assessments
-
Market segment load forecasts/assessments for:
- Smart grid technologies
- Battery storage
- Solar technologies
- Smart grid technologies
- Microgrids
Briefly, using the OpenEI NREL energy use and hourly loads data are likely to result in large
errors when applied to these analysis areas because
OpenEi NREL prototype building energy use and hourly loads:
-
Do not reflect relevant market segments
-
Ignore diversity in the building population
-
Reflect questionable load profiles
Each of these issues is addressed in more detail below. The reference for this discussion is the
Openei NREL residential data (openei.org, "Commercial and Residential Hourly Load Profiles for all
TMY3 Locations in the United States");
however, these comments and conclusions apply equally to the commerciall hourly load data.
1. Market Segment Mismatch
Market-based information nearly always requires data for selected market segments.
Energy/hourly loads of customer segments defined by income, householder age,
electric appliance holdings and other variables
will be significantly different than energy and hourly loads of OpenEI NREL prototype engineering simulation results.
For example, energy technology sales targeting
applications often target certain income segments
while smart grid applications typically need to differentiate among customer segments based on contributions
to peak electricity demands during system peak periods.
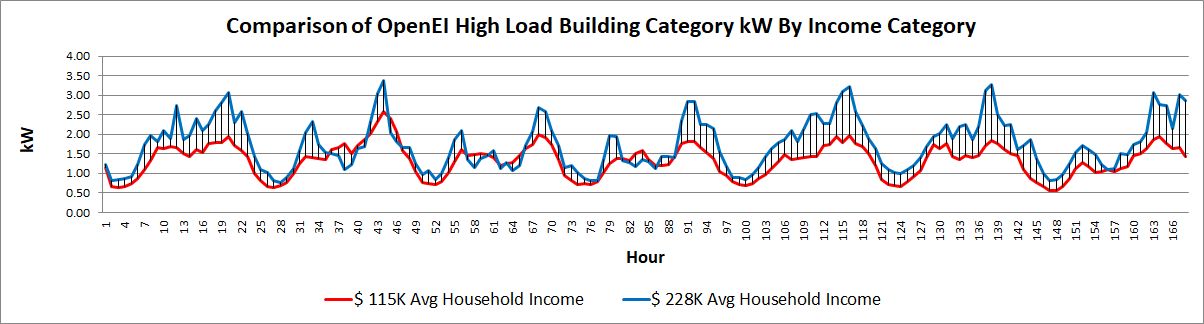
The chart below shows a comparison of OpenEI NREL load data for the first 7 days in the high energy-use residential
dwelling unit for Napa, California and data for a sample of MAISY utility customer records for the same location.
The 73 records in the MAISY data sample are selected to conform to the OpenEI NREL dwelling unit model parameters including natural gas space and
water heating, electric cooking, electric
clothes dryer. The average dwelling unit size in the MAISY sample is 3,000 square matching the OpenEI NREL dwelling unit assumption.
To illustrate the importance of segment-based analysis, the MAISY sample of customers was divided into three
household income categories with boundaries of less than $75,000, between $75,000 and $150,000 and greater than
$150,000. Assuming that a technology a sales strategy targets households with income above $75,000, the chart
shows load shapes for these two income categories. What the chart also shows is that there is a significant difference
between mid- and high- income load profiles. High income customers have significantly greater peak kW and greater kW variation
than middle-income customers.
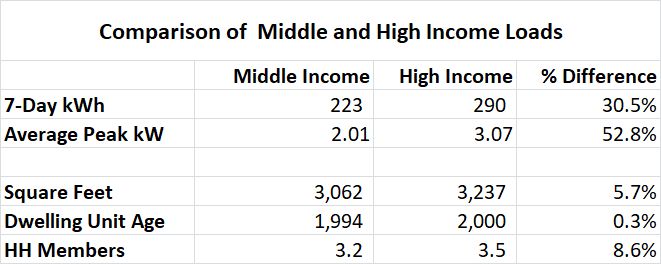
A comparison of loads for the two categories shown below the chart provides the basis for several conclusions
shows several that s that this difference in
-
Load shapes are significantly different between the two income segments
-
Higher income households have much greater peak kW relative to total kWh use
-
Differences in dwelling unit size and age number of household members cannot be used as factors
to translate from one income category to another
Conclusion: Market analysis that targets market segments must utilize data for those segments rather than using
an approximation based on prototype representations or data for another segment.
2. Limited Representation of Utility Customer Diversity
OpenEI NREL residential engineering model simulations are based on dwelling unit/appliance characteristics
documented in the following graphic. Three
building designs are specified for each of five climate categories. Engineering model simulations are conducted
using the three building designs for each of the 1020 TMY3 weather station locations.
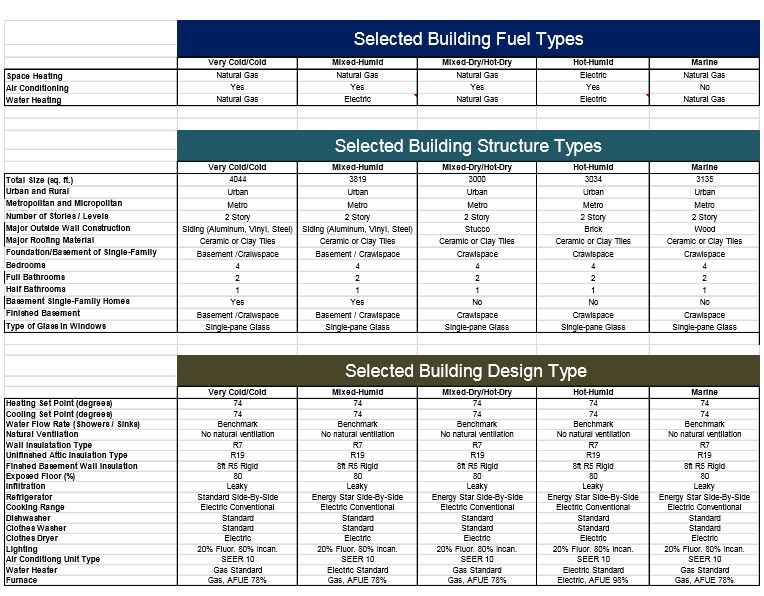
However, a quick review of prototype buildings shows an extremely limited representation of the diversity in
utility customer characteristics and energy use. Three dwelling unit sizes are represented with 1,000, 2,000
and 3,000 square feet prototypes. Energy use determining characteristics within each size category are similarly limited.
For example in the mixed dry/hot dry climate zone, space heating and water heating fuels are specified as natural gas.
If we assume a reasonably typical average annual electricity use of 8,000 kWh for a 3,000 square foot California dwelling
unit represented
by this high-use prototype, consider what would happen if the prototype used electricity for water heating and space heating.
The annual use would increase to about 12,000 kWh with a significantly different hourly load profile. Electric space heating
increases overnight loads, often peaking in the morning and declining through the day. Water heating load
profiles typically reflect peaks
in the morning and later in the day. Adding in a second refrigerator would increase annual kWh to about 13,000 kWh while
a swimming pool pump
would bring the total to more than 16,000 annual kWh with accompanying changes in the kW load profile.
Other diversity to be considered
includes household income, number of family members, clothes dryer fuel, use of a free-standing freezer, etc.
The question for market analysis is what dwelling unit/appliance/demographics/operational characteristics are likely to define
the market segments of interest, how do the segments differ in energy/hourly loads characteristics and how many potential customers
are in each segment. As indicated in the section above, utility customer segment profiles can differ dramatically across
many of these dwelling unit, occupancy and appliance combinations. The OpenEI NREL data provides no energy or hourly load information on
these important issues.
Conclusion: OpenEI NREL hourly loads reflect extremely limited characterizations of dwelling unit structure,
occupancy and appliance choices that are unlikely to reflect actual utility customers associated with
energy market related analysis.
3. Questionable Load Profiles
Engineering building models are notoriously poor at reflecting actual building load profiles. While weather-sensitive end use
components reflect traditional heat-load model analysis (which may or may not be of acceptable accuracy), non-weather
sensitive end use load profiles reflect assumed values. Since
nonweather sensitive loads typically reflect the vast majority of electricity use, relying on the OpenEI NREL assumed nonweather
sensitive load profiles is risky.
MAISY nonweather sensitive loads are based on metered appliance data reflecting more accurate and more realistic load data.
The chart below shows a comparison of OpenEI NREL and MAISY nonweather sensitive loads for an area around Napa California.
The OpenEI NREL data reflect the high-energy use model which assumes gas space heating and gas water heating,
electric cooking, electric
clothes dryer. The MAISY data
reflect the average of 48 residential dwelling units averaging 3,000 square feet also reflecting the same appliance characteristics
as the OpenEI NREL prototype building
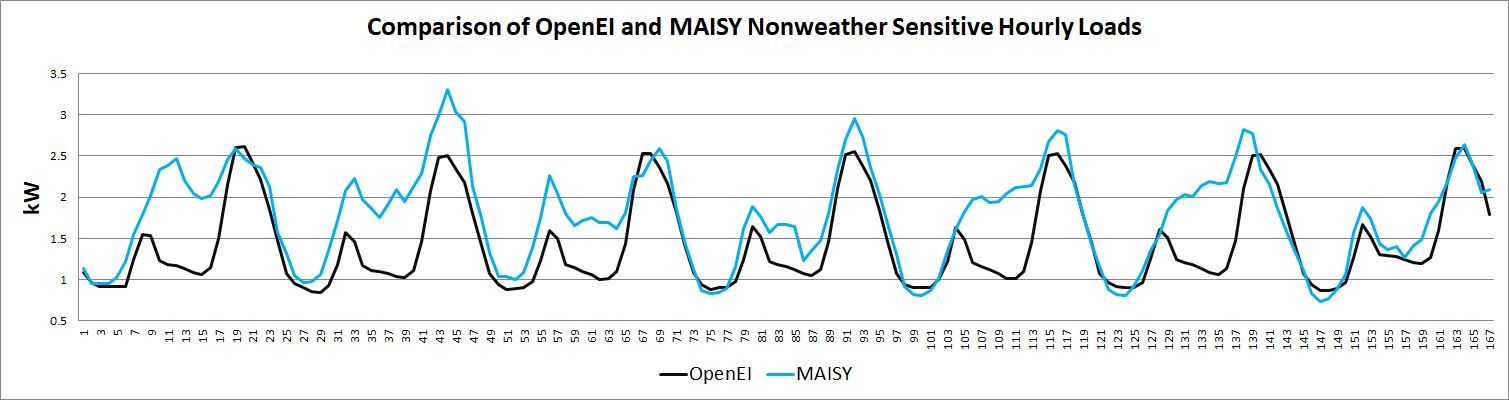
Several observations can be drawn from this comparison based on the fact that MAISY hourly loads are based on actual metered data and
OpenEI NREL loads are based on engineering model assumed loads:
-
OpenEI NREL load shapes significantly under-estimate early morning to mid-afternoon loads
-
MAISY loads reflect day-to-day actual variations in load profiles while OpenEI loads are nearly uniform from
day to day.
Conclusion: There is no indication that OpenEI NREL hourly loads reflect accurate profiles; instead,
a comparison
with MAISY hourly load data, which is based on metered data, suggests that the OpenEI hourly loads
suffer from a lack of "real-world" content and engineering model misrepresentations.
|